I keep track of how much I pay for gas. As you can see from the graphic, it’s really variable. However, the past 10 – 12 months, the price has been unusually stable. The red line is a 30 sample moving average.
The numbers for this graph comes from what I’ve actually paid for gas. Most of the purchases are in the Northeastern Indiana area.
Several online sources blame the great recession on a sharp rise in the cost of energy. A flat cost probably has the opposite effect of stabilizing the economy. One reason would be that it allows more effective planning by businesses that are dependent on energy prices.
An analysis of the factors leading to this price stability would be interesting to study.
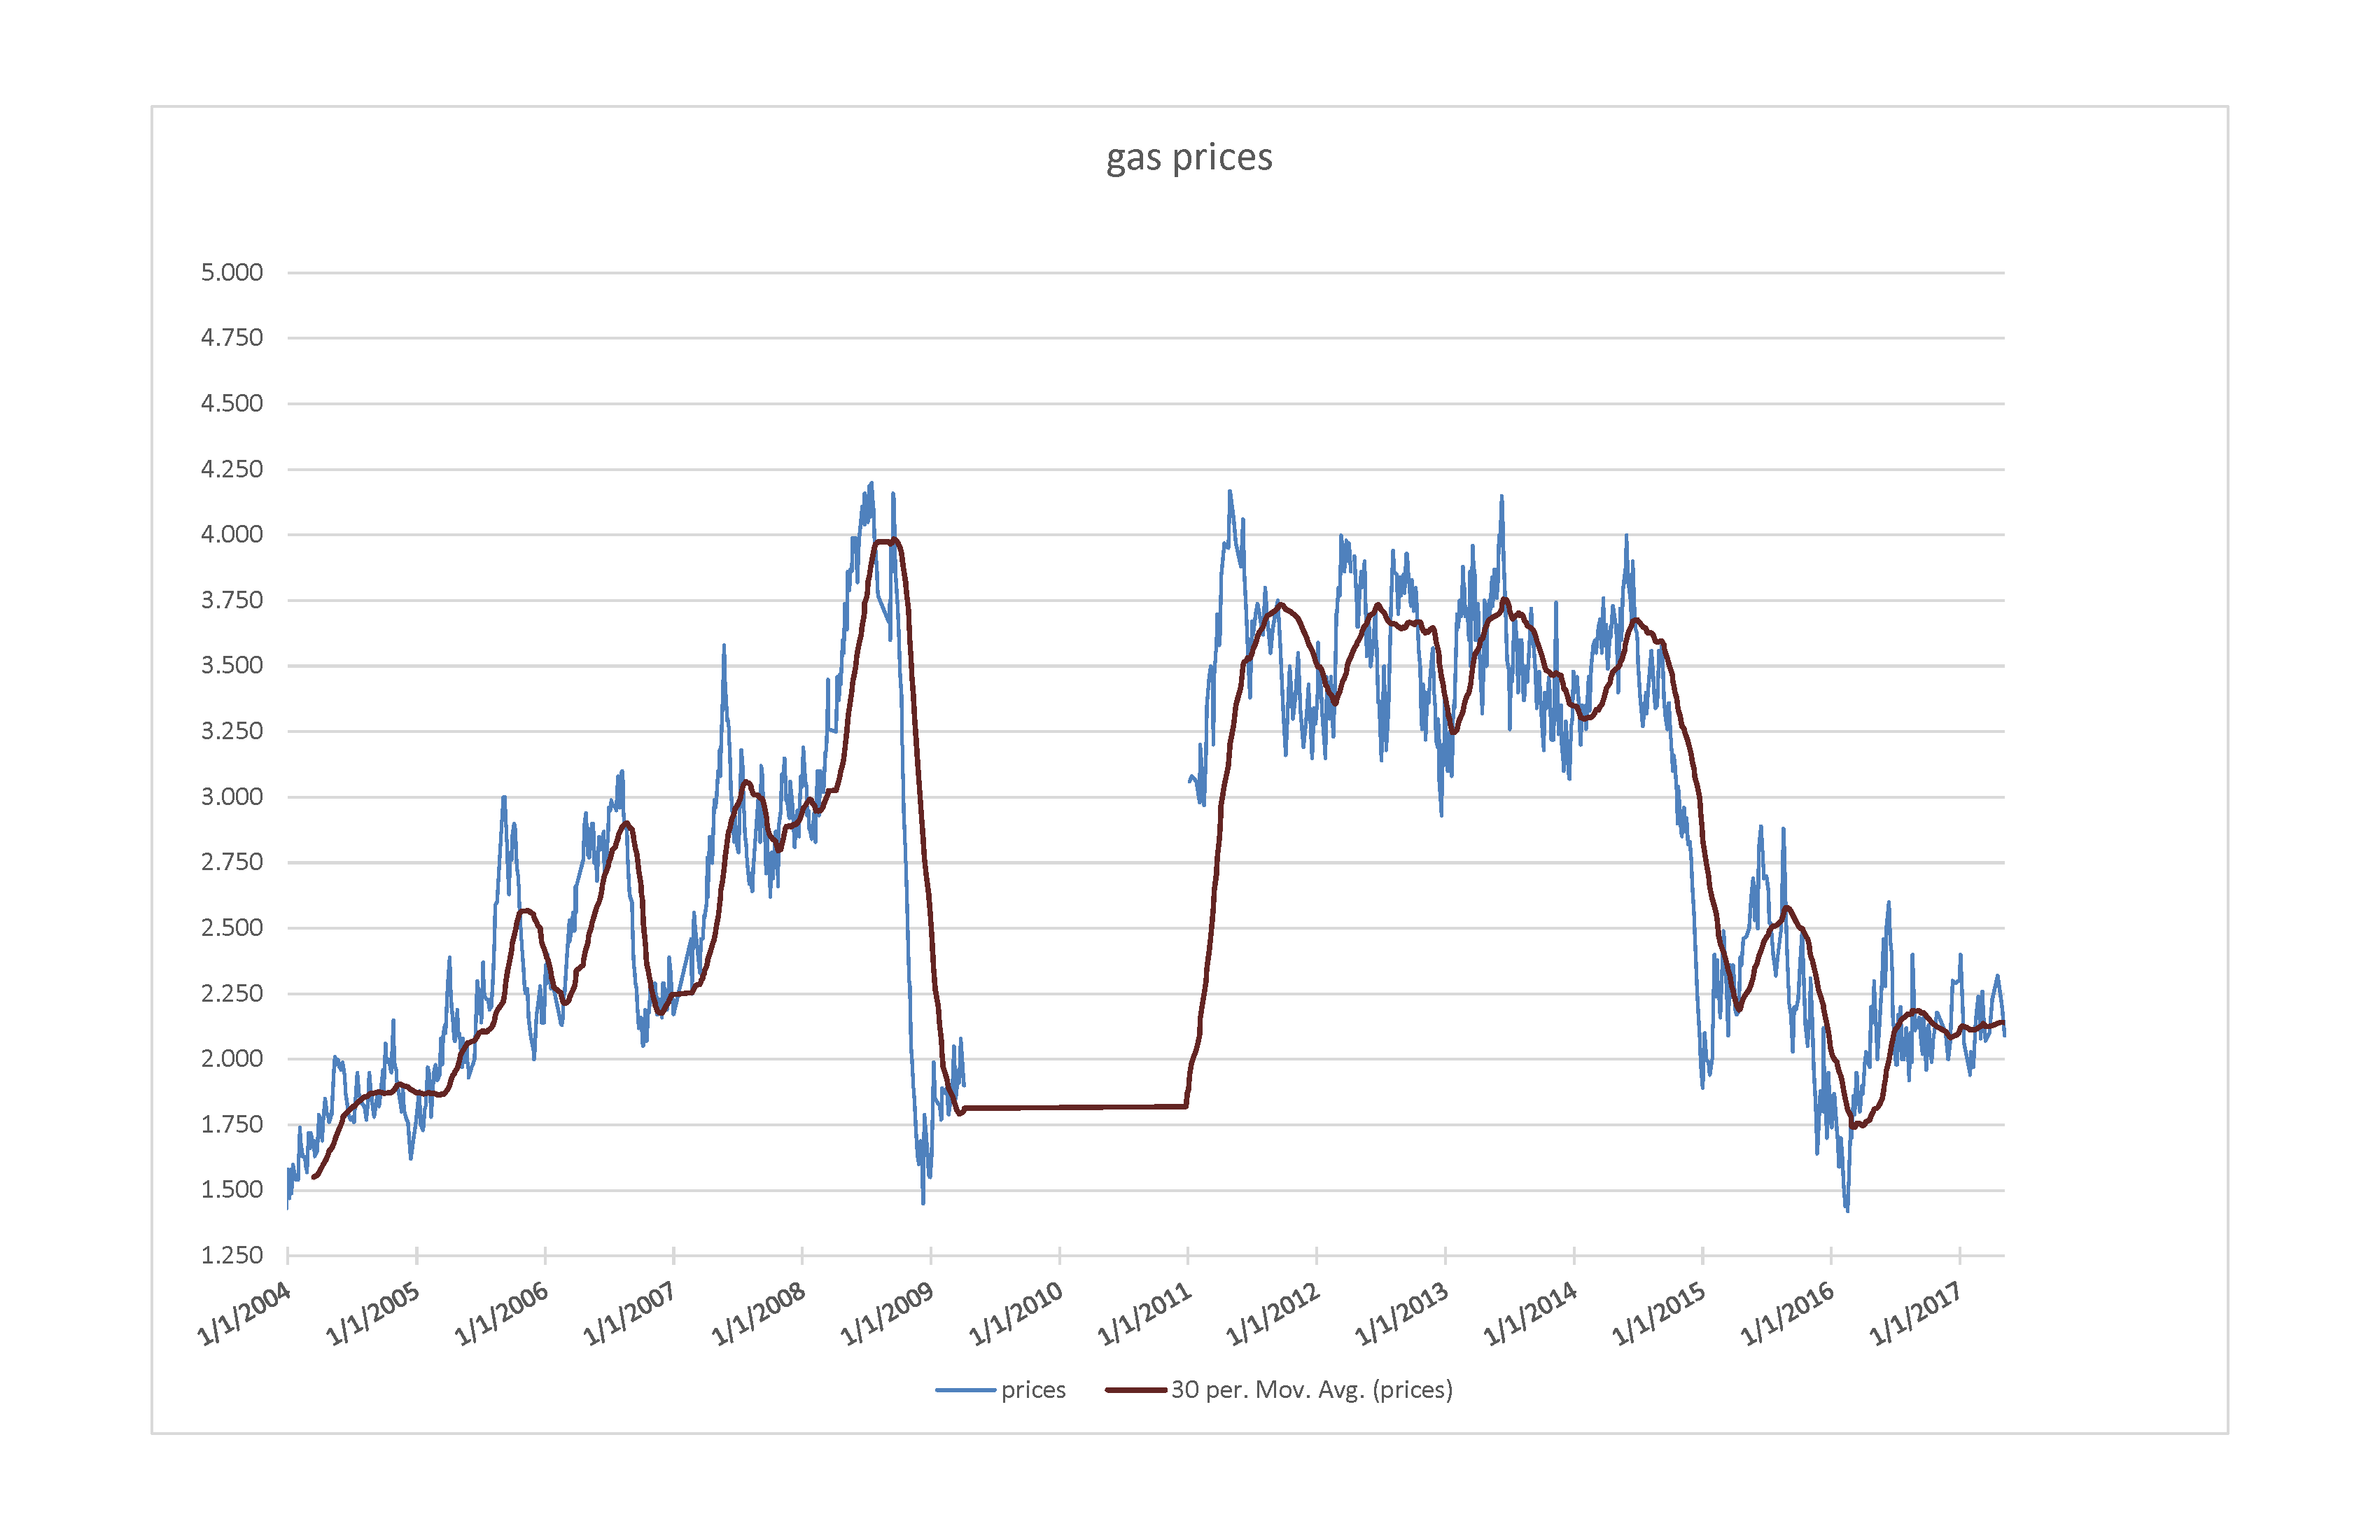
A graph of the prices of gasoline from 2004 to 2017
(The gap between 2009 and 2001 is due to the loss of the file containing that information. I’ve attached a PDF with the same graph.)
